Overview of Afghan Conflict
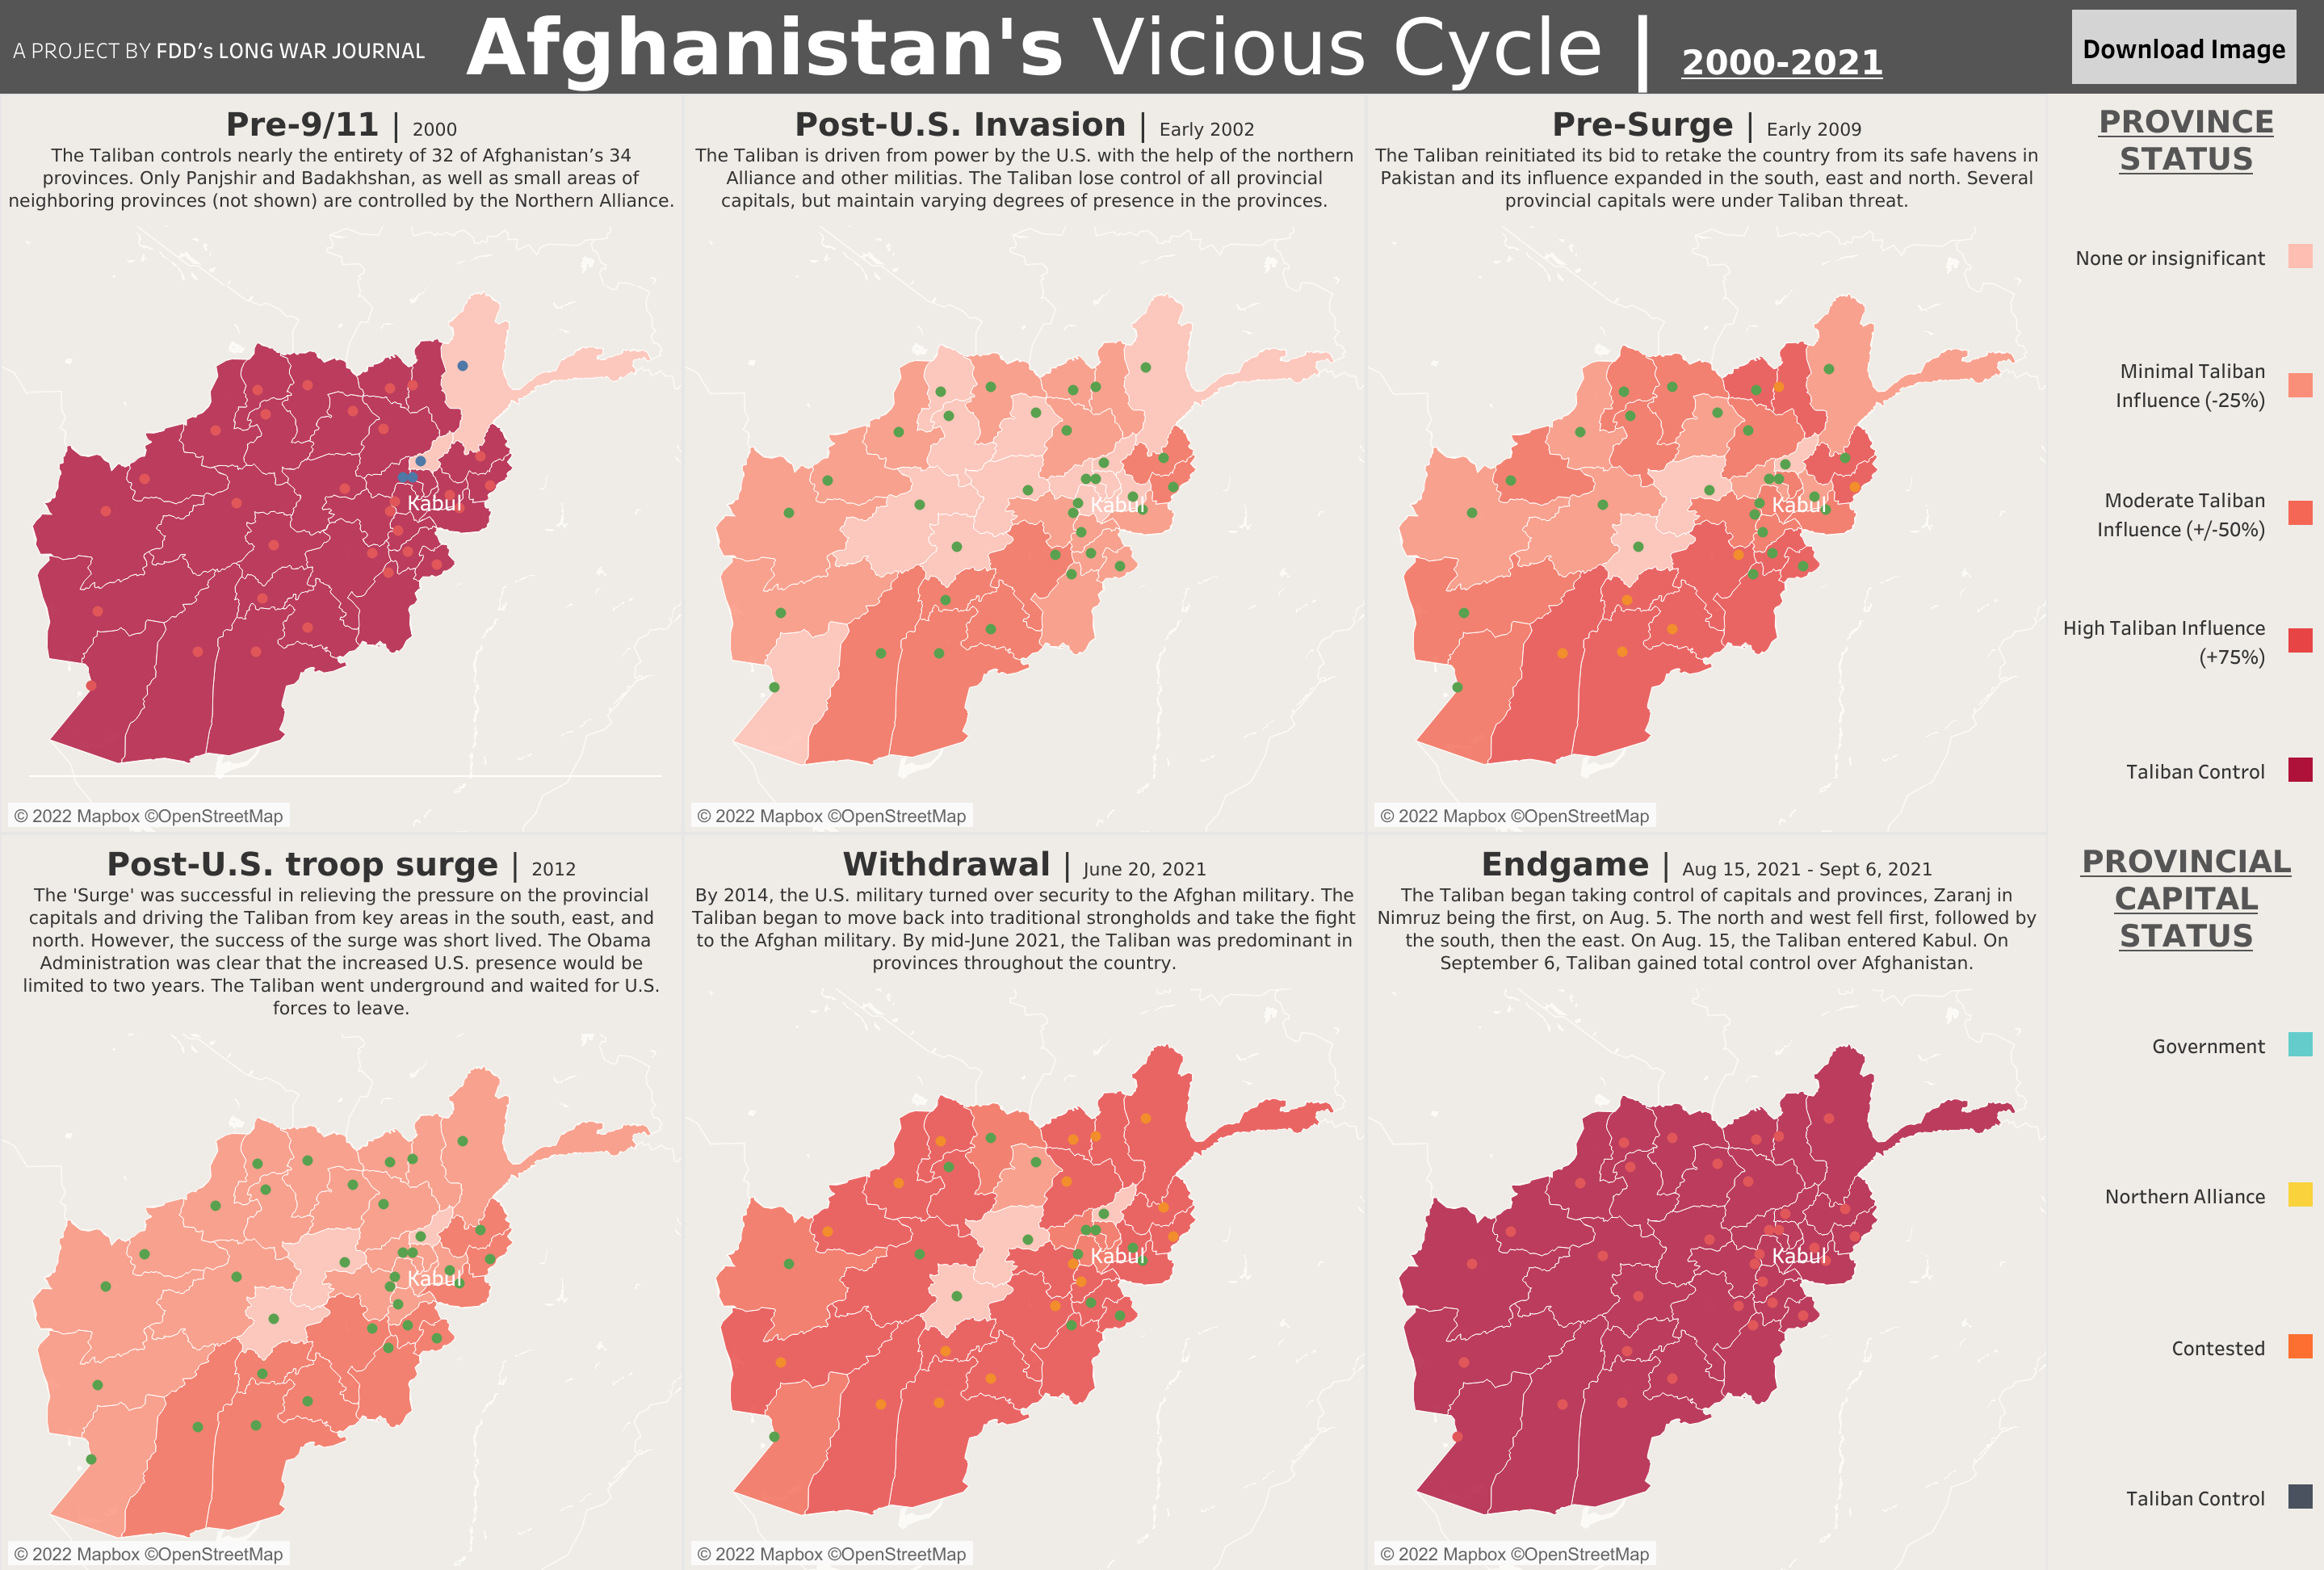
N.B. Working out a consistent set of data is turning out to be a bit of a struggle since different sources of information report on different things, e.g., control of provinces, control of districts, regions of control not necessarily divided by district boundaries, etc. The most informative sources seems to be: https://www.longwarjournal.org/mapping-taliban-control-in-afghanistan.
The following graph, built on FDD's website, seems to indicate that the Taliban never stopped getting stronger despite efforts to counter it. A veritable leaning tower of Pisa of cards was created, and then at one crucial moment a card near the bottom was withdrawn and the whole thing collapsed.
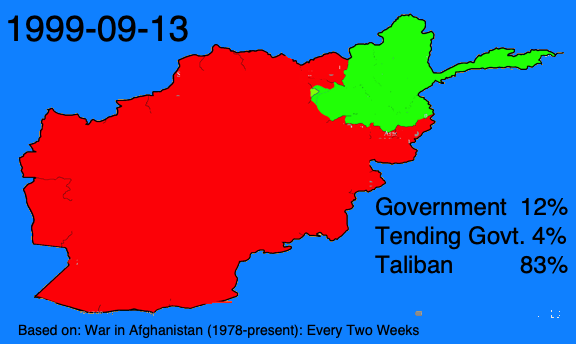
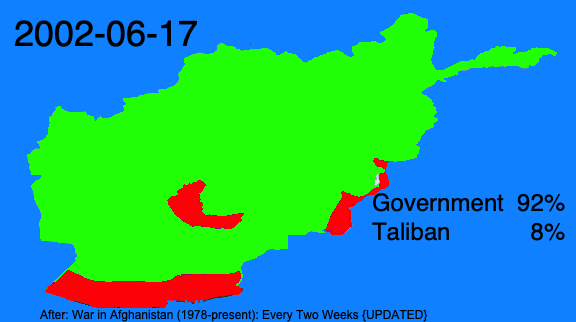
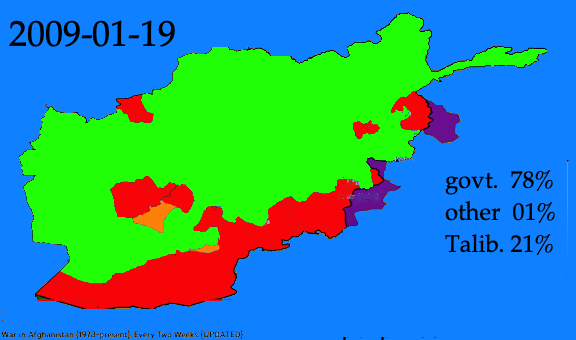
By going through FDD and other maps that give information in terms of colored district images and applying some digital technology, approximations of land amounts controlled or contested at various critical periods have been produced.This graph indicates a remarkable narrative.
Before the invasion of Afghanistan, the Taliban controlled all of Afghanistan except for a small region controlled by the Northern Alliance. After the invasion, the Taliban's hold was reduced to 30% of the region, and the newly established government had control of about 1/3 of the country. Its control never went any higher than that. The remainder of the country, a little less than 1/3, was in contention.
The Taliban began almost immediately to work on recovering control. The regions in contention and the regions held by the Taliban increased roughly in parallel, while the area under government control fell back to around 8%.Outgoing president George W. Bush and incoming president Barack Obama saw the need to reverse this trend.Obama instituted his surge, which removed much territory from complete Taliban control and put it into contention. Some of the contended territory was also put under government control. But after government-controlled territory peaked, the remainder of contended territory went to the Taliban.Government-controlled territory was also attritted.
Obama had made it clear enough in public pronouncements that the surge would come to an end and after that the government would be responsible for protecting itself. American help on the military side would be limited to advise, training, etc. Whatever the government may have done to try to prepare a solid defense, it obviously failed. By the time the last American troops were to be flown out of Afghanistan, the government controlled less that 10% of the country, contested regions were down to less that 20%, and the Taliban forces held almost 3/4 of the country. The Taliban had the momentum, and the rest of the country quickly fell into Taliban hands.
An independent analysis supports the above conclusions. See: https://www.academia.edu/50361928/Peace_Agreement_Between_the_United_States_and_the_Taliban_A_long_road_to_peace_building_in_Afghanistan?auto=download&email_work_card=download-paper
Before 9/11 and the punitive expedition of the USA, the Taliban had control of almost all of Afghanistan.
After the punitive expedition of the US to Afghanistan, the Taliban had lost much of its control, and about one third of the country was contested.
It appears that something happened to give the Taliban a setback in early 2018, but then it inexorably gained in dominance and momentum.
Note that each maker of this kind of map may have a different source of information or standard for evaluating issues of control. Maps for the same period may look rather different when taken from two sources. So for following the development of the struggle between the Taliban and those who resisted the Taliban, it would be best to stick with comparisons of maps from the same source.\
Operating from havens in Pakistan, the Taliban had been working to retake territory in Afghanistan from shortly after being driven out by the US invasion. By 2009, the Taliban had achieved approximately equal power to the government. The Taliban had the momentum, and the Afghan government was failing to protect itself.
After the surge commanded by Barack Obama, the Taliban had been given some heavy losses, but was still ahead of its position after the initial US invasion.
“Sep. 4, 2018 – Afghan-born U.S. diplomat Zalmay Khalilzad is appointed U.S. special representative to seek negotiations with the Taliban.
Oct. 12, 2018 - Khalilzad is reported to have met Taliban representatives in Doha, where they have set up their political office. There are said to already have been earlier meetings, including U.S. State Department officials meeting insurgent leaders earlier in July to have “talks about talks”.” ––https://www.reuters.com/article/us-afghanistan-taliban-timeline-idUSKCN2550G5
—-
—-
What real hope was left for victory by government forces at this time? Take a look at the above images in a single panel. Ask yourself, “When was the government accomplishing enough to improve its chances of survival?” Ask yourself, “When would the US need to have made a surge to avoid either leaving or making a D-day level invasion?
What needed to have been before the invasion or at least before the decision was made to turn a punitive expedition into a long-term invasion and attempting to do nation building? One of the clear indications of trouble is the fact that there was never grassroots support for the government.
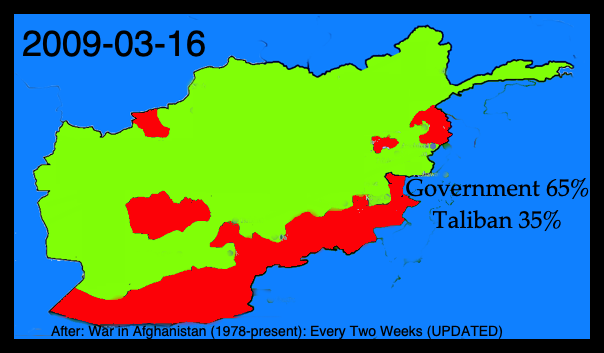
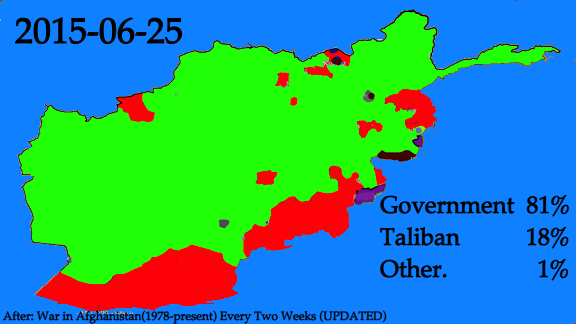
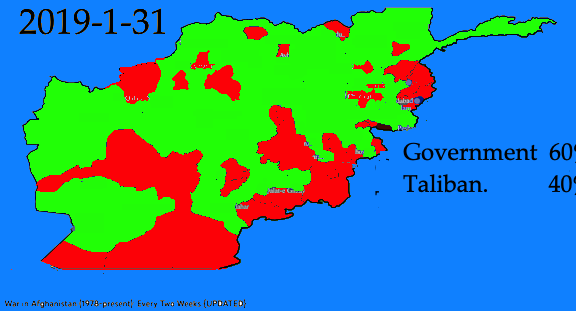
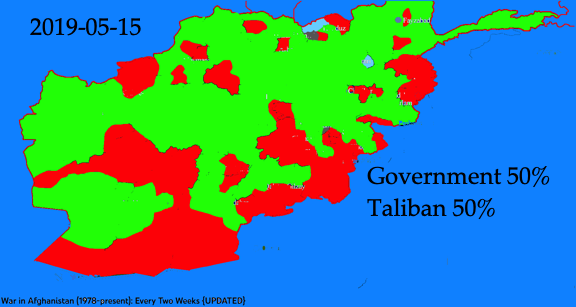
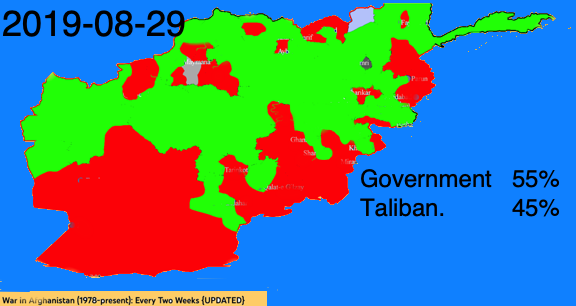
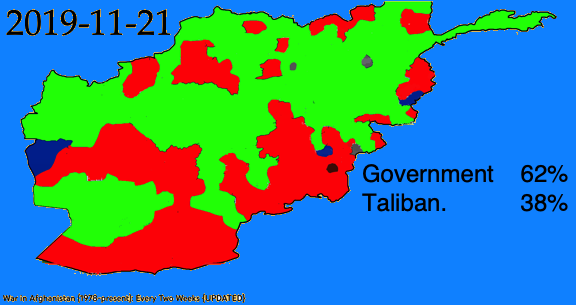
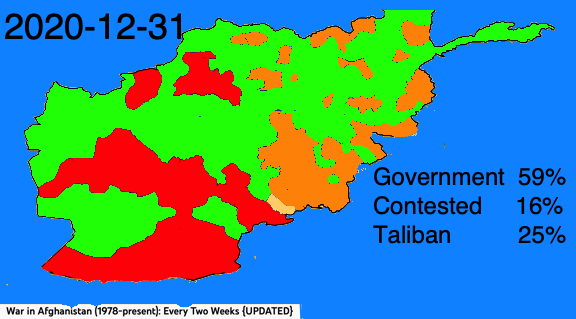
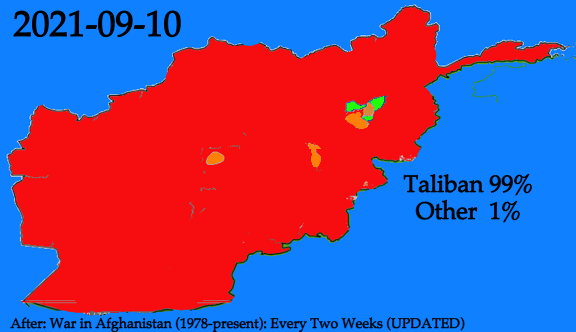
The following maps are all based on https://www.youtube.com/watch?v=JQkCAHMUgCU They give a different impression of what happened. According to this narrative, the government had more than half of the territory until just before the very end, when suddenly their territory plummeted as though there had been an invasion that powerfully aided the Taliban to take over the remaining half of the country. It is tempting to believe that US officialdom believed in this set of statistics and were dumbfounded when control of half the country melted away so rapidly and unexpectedly.
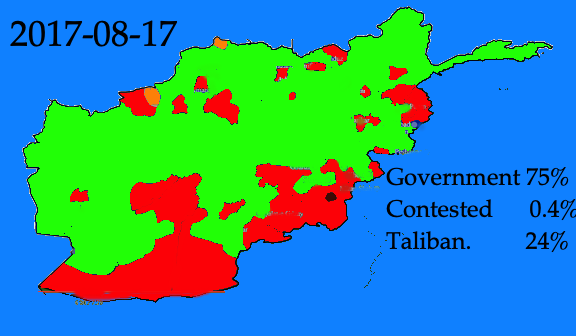 Beginning of the Trump presidency.
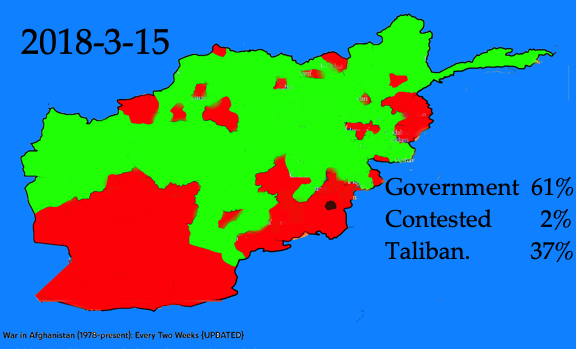 Second year of the Trump presidency.
Summary Charts
Two views on what happened to Afghanistan over the last two decades. The first chart depends on the first series of maps given above, and it appears to me to give an understandable narrative of how the Taliban emerged as winner. The second chart depends on the second set of maps given above, and it appears to be an overly optimistic view of the fortunes of Taliban and anti-Taliban forces. The reports had to conform more to reality as contested areas nominally recorded as being under government control were revealed to be certainly under Taliban control. The second chart is almost a perverse mirror image of the first. If one bases oneself on the second chart, it is more possible to view things in soft focus and claim that Afghanistan was in good shape until Biden became president. However, even the second chart shows things falling apart for the government during the Trump years.
 (Inverted image of the second chart.)
The moral of the story is that if you wear rose-colored glasses
you can't see the flashing blue lights of the police car bearing down on you.
start


